
US high yield: Broader financing options soften impact of higher rates
- 19 June 2024 (7 min read)
KEY POINTS
Heading into 2023, the consensus narrative appeared set. The Federal Reserve had embarked on an aggressive interest rate hiking cycle to combat spiralling inflation. A US recession was expected to follow, as household excess savings built up during the pandemic were exhausted and corporate borrowing conditions tightened dramatically after the benign post-global financial crisis era of low interest rates.
High yield (HY) companies, according to many outlooks, were among the most exposed to this shifting backdrop and were expected to struggle to adjust as the economy deteriorated and banks pulled back from lending. Refinancing options in capital markets for existing debt burdens were also now expected to become significantly more expensive.
Tighter lending standards have often been correlated with US recessions, as demonstrated by the chart below. As a result, there were fears the US HY market default rate would also spike as companies struggled to cope with these headwinds.
Banks tightening lending conditions commercial and industrial firms by size
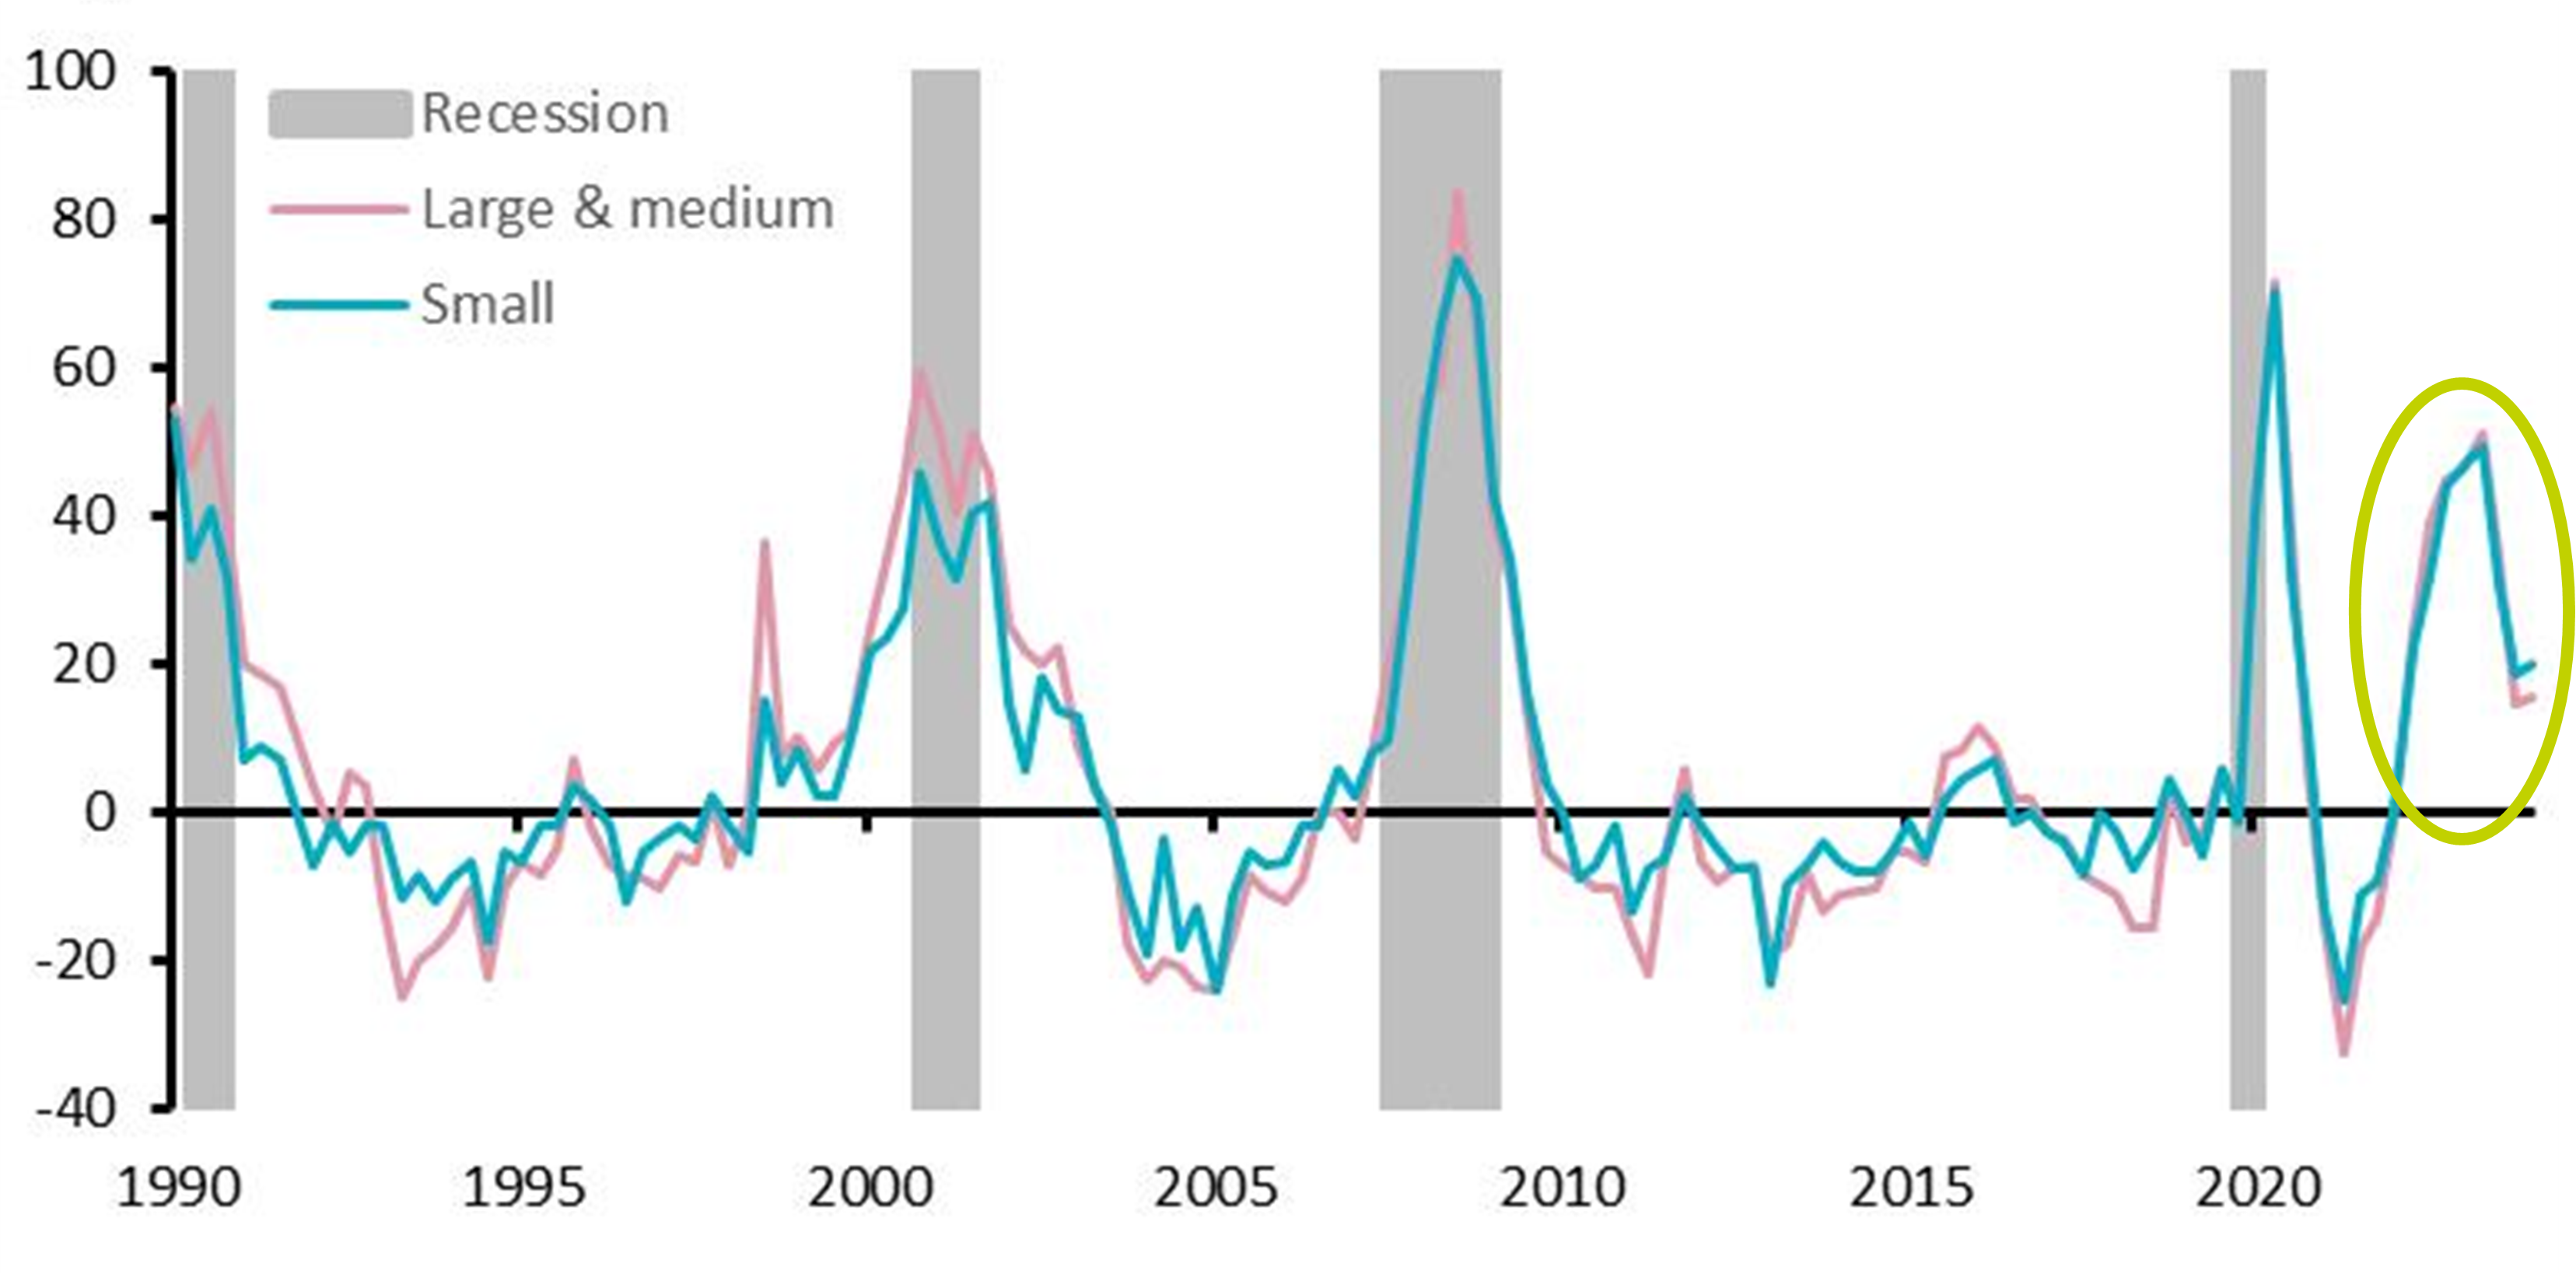
Source: Senior Loan Officer Opinion Survey on Bank Lending Practices – FRB, BEA, AXA IM Research, May 2024. Y axis shows net percentage of domestic respondents tightening standards for commercial and industrial loans.
However, to date, none of these predictions materialised. The US economy continues to surpass expectations, inflation has fallen significantly despite some recent stickiness, while the US HY default rate has remained very manageable – closing May 2024 at just 2.0%, well below the 25-year average of 3.4%.1 And from a return perspective, HY has outperformed higher quality asset classes such as US investment grade (IG) and US Treasuries through 2023 and year to date in 2024.2
Meanwhile, as the chart above demonstrates, lending standards have since eased materially, as have concerns over a US recession, suggesting that perhaps this historical trend may have been broken.
To understand why, we need to consider how the overall landscape of US leveraged finance has evolved and how this, in turn, has shifted the dependence of HY companies away from traditional forms of bank lending towards other, more diversified, sources of capital.
- Si5QLiBNb3JnYW4gRGVmYXVsdCBNb25pdG9yIGFzIG9mIDMxIE1heSAyMDI0LiBQYXItd2VpZ2h0ZWQgZGVmYXVsdCByYXRlIGluY2x1ZGluZyBkaXN0cmVzc2VkIGV4Y2hhbmdlcy4gRXhjbHVkaW5nIGRpc3RyZXNzZWQgZXhjaGFuZ2VzLCB0aGUgZGVmYXVsdCByYXRlIHdhcyAxLjMlIGFzIG9mIHRoZSBzYW1lIGRhdGUu
- SUNFIEJvZkEsIGFzIG9mIDMxIE1heSAyMDI0LiBPdXRwZXJmb3JtYW5jZSBpcyBiYXNlZCBvbiBhIGNvbXBhcmlzb24gb2YgdGhlIElDRSBCb2ZBIFVTIEhpZ2ggWWllbGQgSW5kZXggcmV0dXJucyBhbmQgdGhlIElDRSBCb2ZBIFVTIENvcnBvcmF0ZSBJbmRleCBhbmQgSUNFIEJvZkEgVVMgVHJlYXN1cnkgSW5kZXguIFBhc3QgcGVyZm9ybWFuY2UgaXMgbm90IGEgZ3VpZGUgdG8gZnV0dXJlIHBlcmZvcm1hbmNlLg==
US public credit market development
Since the last significant recession brought about by 2008’s crisis, the combined value of the US public credit market, which includes IG, HY and leveraged loan borrowers, has grown from $3.2trn to $10.8trn – a significant 238% increase.
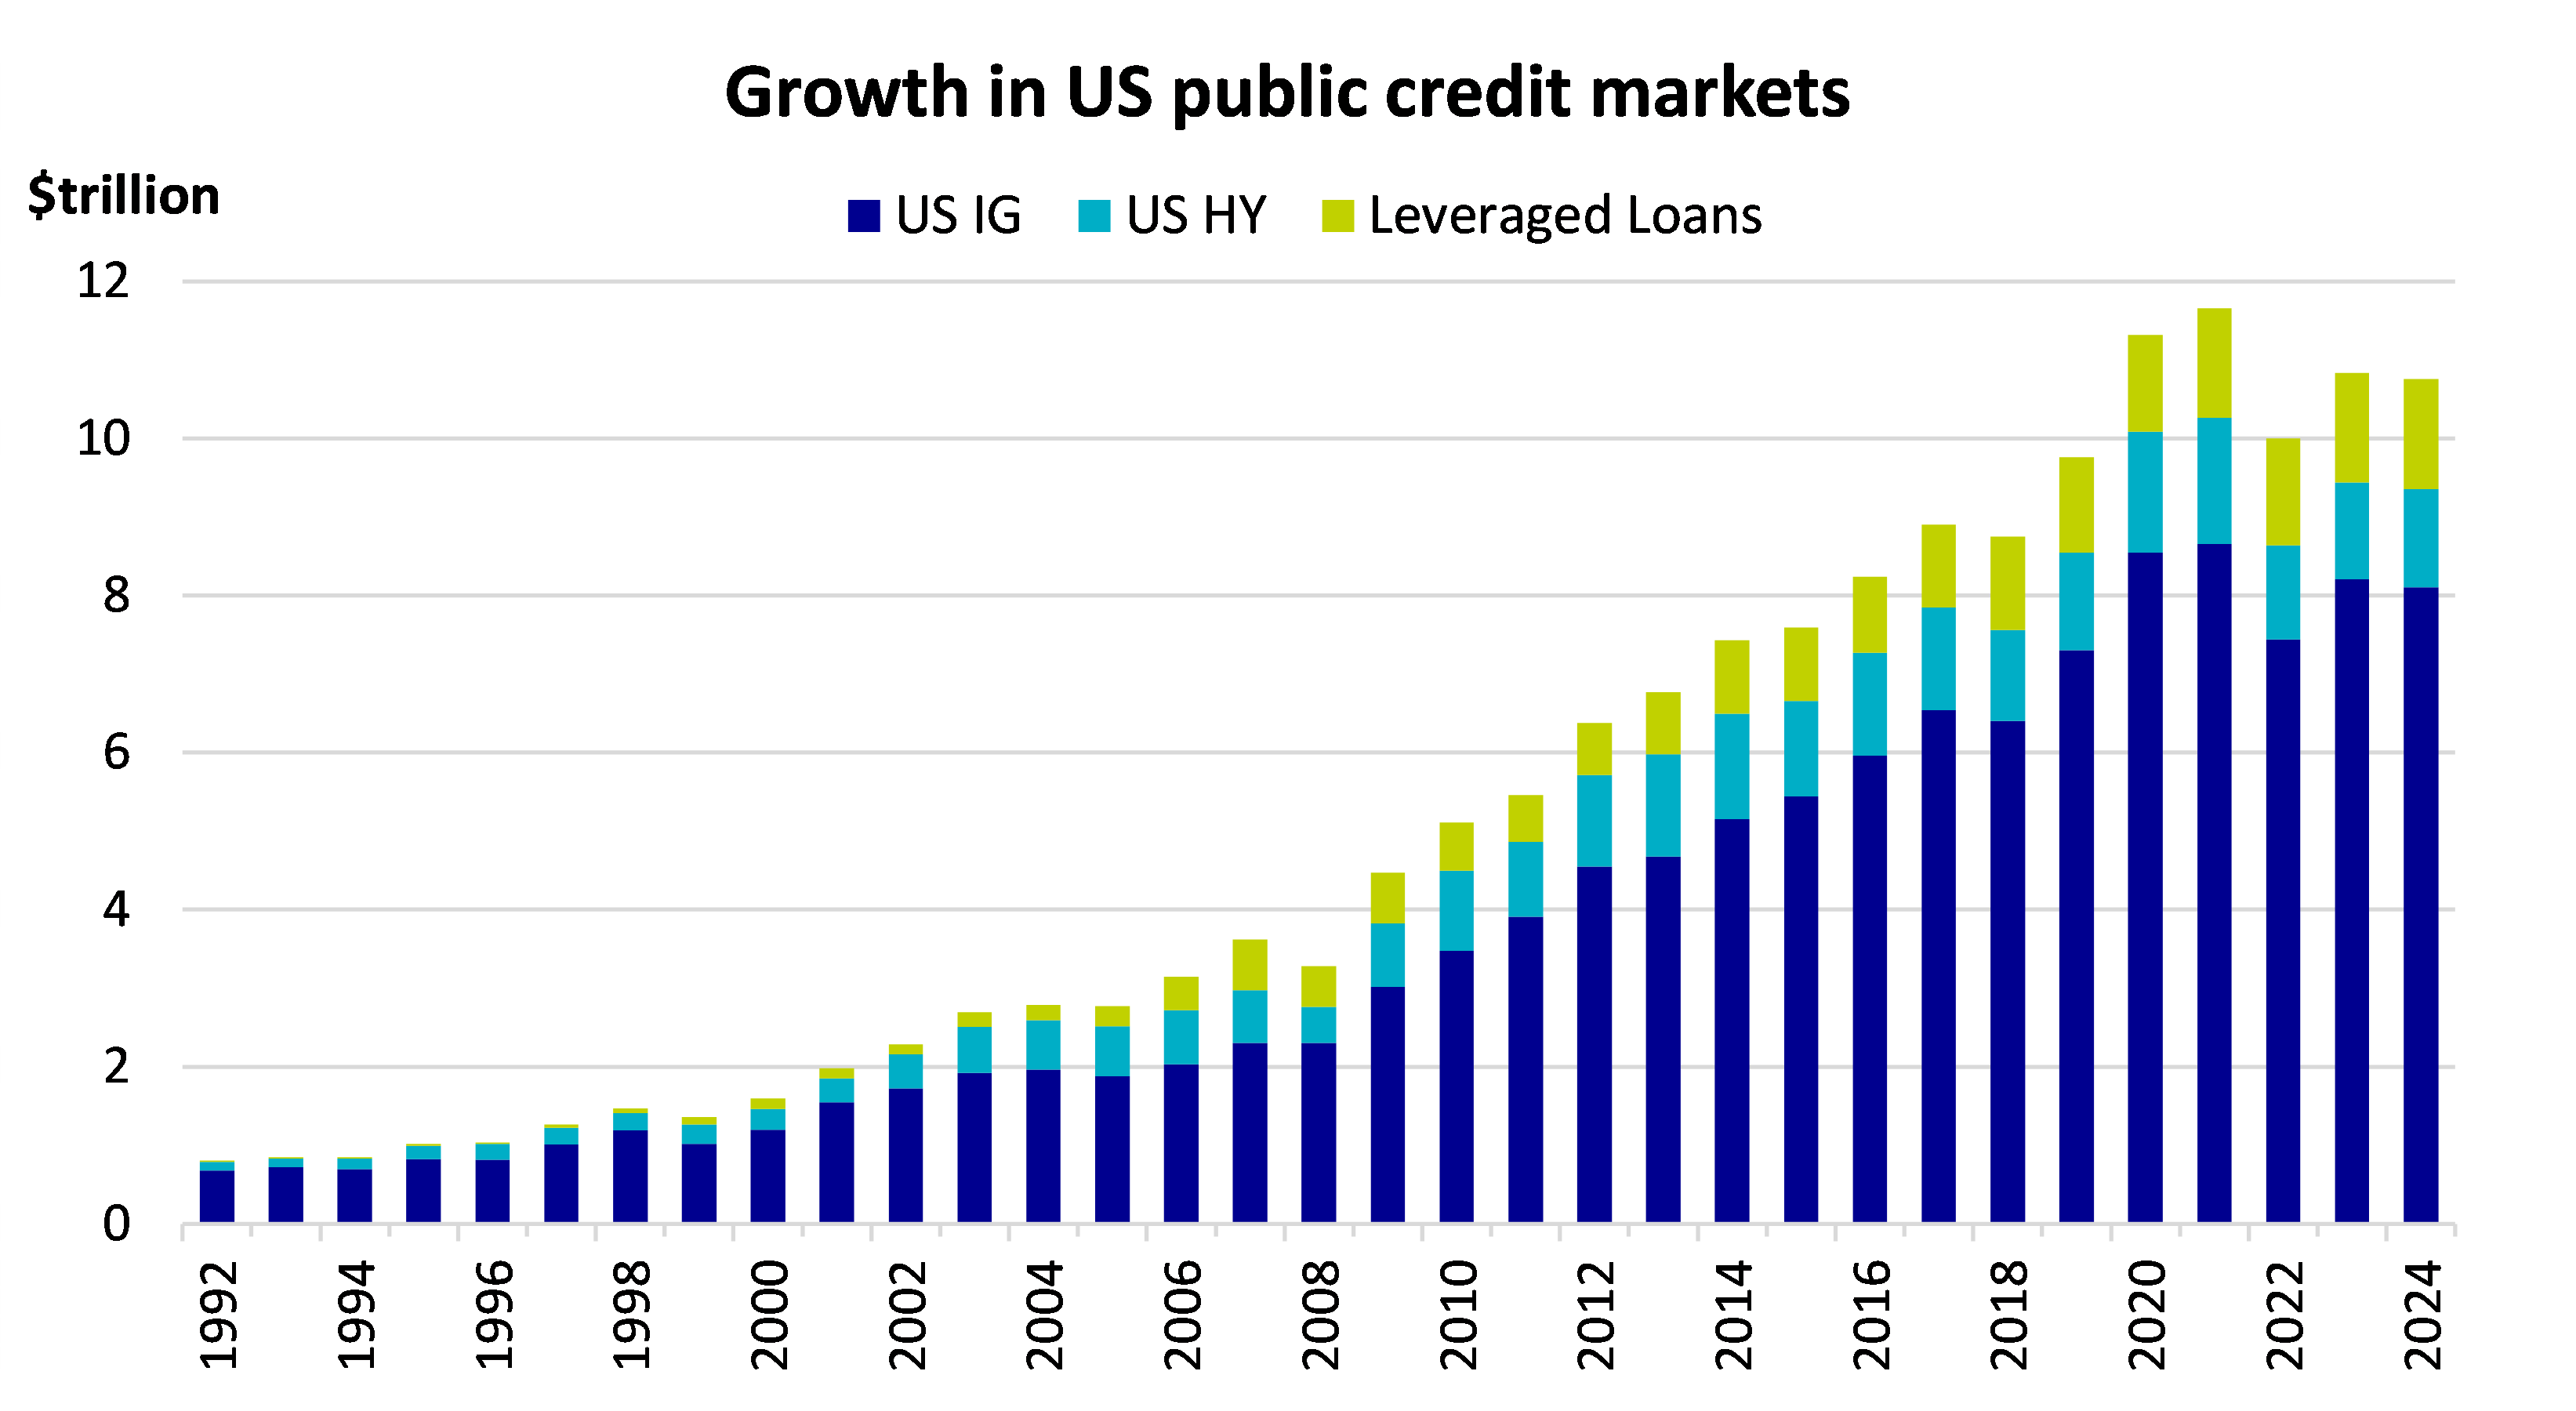
Source: ICE BofA Indices for US IG and US HY, Credit Suisse Leveraged Loan Index for Leveraged Loans. 2024 as of 30 April 2024.
This period of expansion has been bolstered by the generous monetary and fiscal programmes put in place, giving corporates more confidence to borrow in capital markets instead of from the traditional banking system.
As a result, the number of leveraged credit issuers specifically (i.e., HY bonds and loans) increased from 1,128 in 2008 to around 1,900 today.3 But there has also been a shift in the composition of the types of capital structures accessing the public markets. The majority of the growth has come from loan-only issuers, increasing from 413 in 2008 to over 970 today (37% vs. 51% of total leveraged credit issuers),4 which has driven the US leveraged loan market to a size surpassing that of HY for the first time.
The relative attractiveness of loans over this period can be explained by the greater flexibility for borrowers around refinancing options versus bonds, together with cheaper comparable coupons, but the latter has seen an abrupt reversal that is seeing a shift of capital back towards HY bonds once more.
- SlAgTW9yZ2FuIFVTIEhpZ2ggWWllbGQgYW5kIExldmVyYWdlZCBMb2FuIFN0cmF0ZWd5LCBhcyBvZiBNYXkgMjAyNA==
- SlAgTW9yZ2FuIFVTIEhpZ2ggWWllbGQgYW5kIExldmVyYWdlZCBMb2FuIFN0cmF0ZWd5LCBhcyBvZiBNYXkgMjAyNA==
Absorbing the impact of higher rates
Driven by the rise in interest rates over 2022-2023, the leveraged loan market's average coupon, which is priced at a floating rate, increased by 527 basis points (bp), compared to just 43bp on the average fixed rate coupon of HY bonds. High yield bond issuers therefore have more time to adjust to today's higher rate environment, with many of these companies putting in place very low coupon debt at eight-to-10- year maturities over the past few years when rates were low. This means that HY company balance sheets generally remain resilient while both leverage and interest coverage ratios remain healthy, despite a pick-up in dispersion.
Meanwhile, there is less pressure today on the overall HY market from the immediate impact of higher rates being felt by loans because the surge in loan-only borrowers has decreased the number of HY capital structures with a combined bond and loan/floating rate exposure. This is an area that will need to be closely monitored among combined HY bond and loan issuers for any downward pressure that the additional expense incurred by the loan component may put on the whole capital structure.
So, has the impact on the US HY market merely been postponed, not avoided, until bonds are refinanced or mature? The evidence so far suggests the HY bond market is adapting well, underpinned by the common shared goal that company management teams now have with bondholders in keeping overall leverage low, so that overall interest expense is not so much higher today than when rates were low. This is leading to idiosyncratic credit improvements across the HY rating spectrum.
However, a small percentage of the HY market consists of companies entering this period with negative operating trends and more leverage, finding themselves unable to adjust their capital structure or raise new capital to cope with higher rates. Here, problems are emerging – leading to liability management exercises and distressed exchanges, when companies restructure their debts to avoid default.
Private credit turns mainstream
As a result of years of low interest rates prior to the recent monetary tightening, the hunt for yield drove investors increasingly towards the liquidity premium offered by private markets. With banks doing less commercial lending than they had in the past and demand for private deals growing, it was a matter of time before supply would also pick up.
Stepping into the void has been the booming private credit market, which today is enjoying something of a golden age. Estimated by the International Monetary Fund at a size of just over $2trn, most of which is in North America, private credit is now rivalling both HY and leveraged loan markets for size.5 Its true size is likely to be even higher, as approximately 30% of this total is made up of ‘dry powder’, i.e. undrawn capital commitments, while business development companies (BDCs) are not fully accounted for.
To highlight its influence as a viable financing option in today’s market, the majority of leveraged loans in 2023 were funded by private credit firms and the banks’ share of private lending in the US economy is currently as low as 35%, down from 60% in 1970.6
Whatever its size, as more capital has flowed in – from increasingly mainstream sources such as retail and wealth management investor bases – direct lenders are now able to execute bigger deals, appealing to larger, traditional borrowers in public credit markets who are able to tailor each private deal to their needs. There are clear risks in the growth of private credit around the liquidity and opacity of private deals, which are not marked to market, particularly given the higher issuer concentration of direct loan portfolios than in public debt markets. But HY issuers today have access to more diversified sources of capital than ever before, alleviating some concerns around tightening bank lending standards.
- SU1GLCBGaW5hbmNpYWwgVGltZXMsIGFzIG9mIEFwcmlsIDIwMjQu
- RmluYW5jaWFsIFRpbWVzLCBQaXRjaEJvb2sgTGV2ZXJhZ2VkIENvbW1lbnRhcnkgRGF0YSwgTmF0aW9uYWwgQnVyZWF1IG9mIEVjb25vbWljIFJlc2VhcmNoOiBUaGUgU2VjdWxhciBEZWNsaW5lIG9mIEJhbmsgQmFsYW5jZSBTaGVldCBMZW5kaW5nLCBwdWJsaXNoZWQgRmVicnVhcnkgMjAyNC4=
A new chapter
The gradual disintermediation of the banking industry in favour of first public and now private credit markets is well documented. The initial establishment of the US HY market in the mid-1980s was itself an early contributing factor. Today, more recent developments across the triumvirate of US leveraged finance (HY, leveraged loans and private debt) are writing a new addendum to this narrative, which is helping to soften the impact on HY borrowers from higher rates as bank lending standards tighten.
Although often considered to be competing with one another for investor capital, the reduced overlap shared by loan and HY bond issuers today because of the growth of loan-only borrowers has simultaneously supported the HY bond market by reducing its exposure to potential deteriorating trends in the loan market. This could be significant with the threat of a multi-notched downgrade across the 56% of the loan market rated mid-single B or lower casting its shadow over US leveraged finance in general.7
Meanwhile, there is no reason to believe the public HY bond market cannot coexist and complement more recent developments in private credit by offering borrowers a potential holistic investment lifecycle. According to this theory, private credit can be beneficial in the early stages of corporate sponsorship to maximise the probability of financing outcome, but as the company matures and is able to improve its rating and credit profile, the balance should tip more in favour of public credit markets to optimise pricing and reduce all-in financing costs.8
As uncertainties persist at the macro level, at the micro level a new chapter is opening for US leveraged finance. The cheap financing of the last decade is over, but the HY market is finding ways to adapt to this new landscape. As the balance between public and private credit markets ebbs and flows, perhaps the greatest support in the face of higher rates may just be found from within.
- Q3JlZGl0IFN1aXNzZSBMZXZlcmFnZWQgTG9hbiBJbmRleCwgdGFraW5nIG5vbi1zcGxpdCByYXRpbmdzIGZvciBCLCBCLSBhbmQgbG93ZXIsIGFzIG9mIEFwcmlsIDIwMjQu
- SlAgTW9yZ2FuIENyZWRpdCBXYXRjaCwgNSBBcHJpbCAyMDI0Lg==
Disclaimer
This website is published by AXA Investment Managers Asia (Singapore) Ltd. (Registration No. 199001714W) for general circulation and informational purposes only. It does not constitute investment research or financial analysis relating to transactions in financial instruments, nor does it constitute on the part of AXA Investment Managers or its affiliated companies an offer to buy or sell any investments, products or services, and should not be considered as solicitation or investment, legal or tax advice, a recommendation for an investment strategy or a personalized recommendation to buy or sell securities. It has been prepared without taking into account the specific personal circumstances, investment objectives, financial situation or particular needs of any particular person and may be subject to change without notice. Please consult your financial or other professional advisers before making any investment decision.
Due to its simplification, this publication is partial and opinions, estimates and forecasts herein are subjective and subject to change without notice. There is no guarantee forecasts made will come to pass. Data, figures, declarations, analysis, predictions and other information in this publication is provided based on our state of knowledge at the time of creation of this publication. Whilst every care is taken, no representation or warranty (including liability towards third parties), express or implied, is made as to the accuracy, reliability or completeness of the information contained herein. Reliance upon information in this material is at the sole discretion of the recipient. This material does not contain sufficient information to support an investment decision.
All investment involves risk, including the loss of capital. The value of investments and the income from them can fluctuate and investors may not get back the amount originally invested. Past performance is not necessarily indicative of future performance.
Some of the Services and/or products may not be available for offer to retail investors.
This publication has not been reviewed by the Monetary Authority of Singapore.